
Now presumably, this tweet was aimed at countering the inconvenient fact that the correlation between price inflation (i.e. CPI) and gold is virtually zero. And, if predictions of imminent hyperinflation have yet to materialise, well then at least "hard money" types can point to way in which monetary inflation has manifesting itself in the surging gold price of the last decade. (There's a lesson to be learned here about the velocity of money, kids, but that will have to wait until another time...)
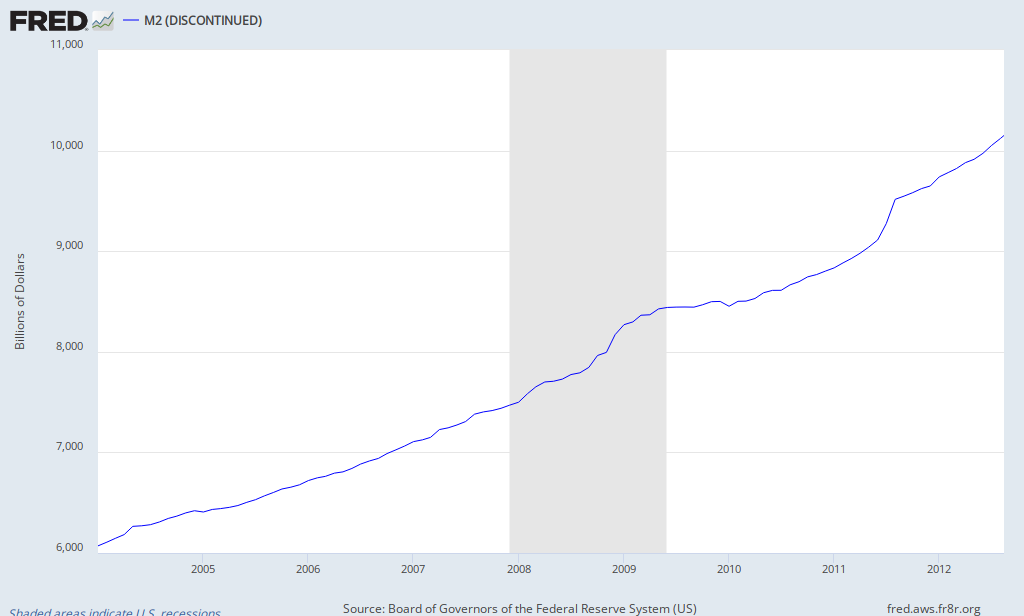
Anyway here's a graph of the gold price and U.S. M2 since 2004, taken from the FRED website. Both are shown in terms of moving monthly averages and, sure enough, the correlation looks very high indeed.
Unfortunately, there are two things wrong with this picture. The first is that the time-frame really does matter. The second has to do with the statistical properties of these series. Let's take these two issues in turn.
Consider what happens when we look at the period from 1981 (which is first date for which FRED has data on both series) until 2004.

Woah! That positive relationship isn't looking too good all of a sudden. Now, of course, I can already hear angry golden-tinged voices accusing me of dueling a strawman. The correlation coefficient was specifically cited for the 2004-post period, so who really cares about what happened 20 or 30 years ago? Okay, perhaps something special happened around the mid-2000s that explains why the two variables have since become so intertwined. Fine, but then don't try to tell me that it's anything specifically to do with money supply. The noticeable kink in the M2 series leading up to that moment occurs around 1995 (after a period of mild tapering), which is close on a decade before the supposed special relationship with gold prices begins.
The broader point here is that if you are going posit a structural theory for why two variables are related, then that relationship needs to have enduring qualities. If not, how can you be sure that gold and M2, rather than one causing the other, aren't both being driven by some other factor? (For one thing, the money supply is supposed to be endogenous to what is happening in the broader economy...) I'm inclined to argue that focusing on the period since 2004 is just a form of data-mining and, as we'll see next, not a particularly good example of that anyway.
Okay. So, ignore the fact that the (weak) longer-term correlation between M2 and gold prices matters. Surely, eight years of data showing a 90%+ correlation can't be denied? Surely, we can say with extreme confidence that recent gold prices have been greatly influenced by money supply? Right?
RIGHT??
Sadly, no. Whenever someone points excitedly to very high correlations between trending time-series, your spidey-sense should be going off like Peter Parker on methylamphetamine. The reason lies with one of the fundamental concepts in time-series econometrics: Nonstationarity.
 |
| Wait a minute. Are those series... nonstationary? |
Without getting too bogged down by statistical concepts, nonstationary series are characterized by a mean and variance that are changing over time. It's not that they can't be growing or declining over time, but rather that they should consistently return to some kind of mean trend. The most important thing from our perspective is failing to account for this issue will generally lead to spurious (i.e. "nonsense") regression results; an idea that goes all the way back to a classic paper by Yule in 1926.
Aaaaaaaand.... as you might have guessed by now, the above series are nonstationary. In technical parlance, they are referred to as random walks with drift. Now, there is a famous exception to this rule that occurs when two series are said to be "cointegrated". Again, I'd rather avoid delving too deeply into the murky waters of statistics in a blog post, but suffice to say that that cointegration does not hold here.
To avoid the problems of
THOUGHT FOR THE DAY: Simply regressing gold prices on any nonstationary series -- whether that be iPhone sales or the number of Crocs™ wearers in Bangladesh -- would likely produce equally impressive, but obviously bogus, results. Now gold fans might be inclined to protest loudly at this point: "Duh", but there's no theoretical basis for linking those goods to gold. We have a theory that predicts the price of gold will rise with (monetary) inflation!" Except that we've just tested that theory and found it, if not entirely wanting, then at least highly oversold.
PS - For anyone interested in checking all of this for themselves, here is some Stata code that I used to test the series. The code will always call the most recently available FRED data, so the exact figures you get may differ from those presented here depending on when you run it.
As promised, here is some Stata code for you to try out. Hours of fun!
ReplyDeleteFirst, download the data from the FRED website and then copy it across to Stata. Then run the following commands:
gen mydate=date(date,"YMD")
format mydate %td
gen time = _n
tsset time
destring m2, replace // You might not have to do this, but my m2 series need destringing
* Correlations without accounting for stationarity
corr m2 gold if time >= 279 //For period after 2004
reg gold m2 time if time >= 279
* Start testing for nonstationarity
corrgram gold if time >= 279
corrgram m2 if time >= 279
dfuller gold if time >= 279, regress trend
dfuller m2 if time >= 279, regress trend
* Use dfgls command to produce Augmented DF dfgls gold if time >= 279
dfgls m2 if time >= 279
// Fail to reject H0: Unit root (i.e. nonstationarity) in each case. Tau stat > Crit values
* Cointegration test
reg gold m2 time if time >= 279 // Things shouldn't change much by including time as a regressor, but better do so
predict u_hat if time >= 279, resid
dfuller u_hat, regress
// Note: Because we are using *estimated* values of the residual, we have to use different critical values to those Stata gives us
// The correct values are -3.90 (for 1% threshold), -3.34 (5% threshold) and -3.04 (10% threshold)
// Regardless, the calculated stat of -2.170 is less than all the critical values.
// We therefore fail to reject H0 (Nonstationary) and are unable to conclude that we have cointegrated series
* Now test differenced series
corr d.m2 d.gold if time >= 279
reg d.gold d.m2 time if time >= 279
Hey McD, hope you're well boet.
ReplyDeleteI'm sure you meant "overbought" not "oversold" in your ending there?
But I have a better question for you.
If the Fed had abstained from increasing base money and lowering the reserve ratio requirement since 1971 when the dollar was de-linked from gold, eliminating the commercial banks' ability to create inflationary credit and money, and M2 money supply was still at $685 billion, do you believe the gold price would be nearer to $35 or $1692/oz?
Look forward to your thoughts bud.
Becks
Hello chine, thanks for stopping by. Some quick responses:
ReplyDeleteOversold vs overbought. Quite right. Truth be told, I actually worried about writing that and even took it out once or twice before posting. Ultimately, I decided to keep it for no better reason that I liked the "sound" of the conclusion. (I try to justify it to myself by saying that it concerns general arguments about the movements in gold... Insert side eye here.)
With regards to your question, I'm afraid that is near impossible to answer, as it would entail a list of counterfactuals that no-one can account for (economic growth would have been significantly affected for one thing)... Still, perhaps I can satisfy your curiosity by saying that the current high price of gold is, in my opinion, only marginally influenced by the direct factors you name. Assuming you disagree -- and limiting the discussion to the post-1980 period in my above graphs -- I am very interested in hearing your thoughts on why it took a full 20 years of expansionary M2 before the gold price started tracking upwards with any sustained momentum?
Okay, I will take that as an answer in favour of $35 rather than $1692/oz if money supply had been kept constant at $685bn.
ReplyDeleteI noticed what you did there with the post-1981 chart you put up. It looks like the correlation breaks down, yet when you do the correlation of the two sets in the post-1981 period, you get 0.76. That's not exactly "weak."
Ignoring this though to answer your question: demand for dollar money had fallen precipitously going into the late 1980s (the inverse of which was the rising gold price at the time), but once Volker tightened monetary policy by hiking short term rates from 5% in 1976 to 20% in late 1980, demand to hold dollars rather than gold, the latter which did not pay interest as it had been excluded from the monetary system, and the rise of the dollar standard that saw global central banks buying dollars to hold as base reserves rather than gold, resulted in declining gold prices from 1981 to 2001.
But once again, the correlation of M2 and gold price from 1968 to present is 0.81. You conveniently leave out the money inflation of the 70s as cause of high gold price that started to decline in 1980.
That said, it is not only a supply of money story, but also demand.
What would you say is the cause for the much higher price level (all goods) today compared to 1981 (ignoring tech prices)?
RE: Your first two paragraphs, I really don't understand how you are arriving at either of those conclusions. I suggest you read the post again to understand why the correlation isn't 0.76. (Hint: Nonstationarity)
ReplyDeleteJudging by these and your other comments, you appear to repeating the *exact* mistakes that I highlight in the post. Unless you have managed to overturn the laws of statistics, looking at a (simple) correlation matrix of nonstationary series is going to produce completely misleading results.
Moreover, as it happens, the only specific correlation figures that I produce above are for the post-2004 period, which is supposedly the period with a 93 percent correlation! (See the code in the first comment.) Once again, this is simply wrong because it fails to account for persistency in the data.
Just so we're clear: When I talk about a 0.3 correlation and an R-squared of 0.1 at the conclusion of my article, that is the true correlation for the "highly" integrated post-2004 period. The severe drop in correlation (0.9 -> 0.3) shows how important it is to correctly adjust for the issues that I have now discussed at some length.
DeleteYou wrote that the current price of gold is only "marginally" impacted by money supply. How can that not imply you would pick $35/oz rather than $1692?
ReplyDeleteI don't think this discussion is even worth having if the demand side for both gold and money is not also discussed or crunched in your numbers. It is not only a supply of money story.
We have misunderstood each other, so let me try again: I think that the current (high) gold price is only marginally due to the fact that M2 has significantly increased over the years. Moreover, I believe that this statement is corroborated by actual testing of the data.
DeleteI can certainly agree that the demand for money and gold are both very important for determining the relevant price level (in conjunction with supply). I'd like do a follow-up post on this subject when I get the chance. However, I am not the one who originally claimed that there is a "93% correlation between M2 and gold". That dubious honour belongs to the likes of Zero Hedge and GoldCore, and betrays a fundamental misunderstanding of statistics for all the reasons that I have laid out in the post.